Figure reects leases reported signed within the report month reported by any agency in Brooklyn and may include furnished and/or short term rentals. Not all leases that are signed are publicly
reported. By bedroom stats exclude units larger than three bedrooms. Price gures based on last asking prices for leases reported signed but actual rents may be lower. Figure reects units actively
listed as of the last day of the report month. Days on market only reects units that were listed for more than one day prior to being marked as leased. All material herein is intended for information
purposes only and has been compiled from sources deemed reliable. Though information is believed to be correct, it is presented subject to errors, omissions, changes or withdrawal without
notice. This is not intended to solicit property already listed. Equal Housing Opportunity. The Corcoran Group is a licensed real estate broker. Owned and operated by Anywhere Real Estate LLC.
Leases Signed
May 2024: Median Rent Surpasses $4,000 for First Time, While Much Needed Supply Reaches Three-Year-High
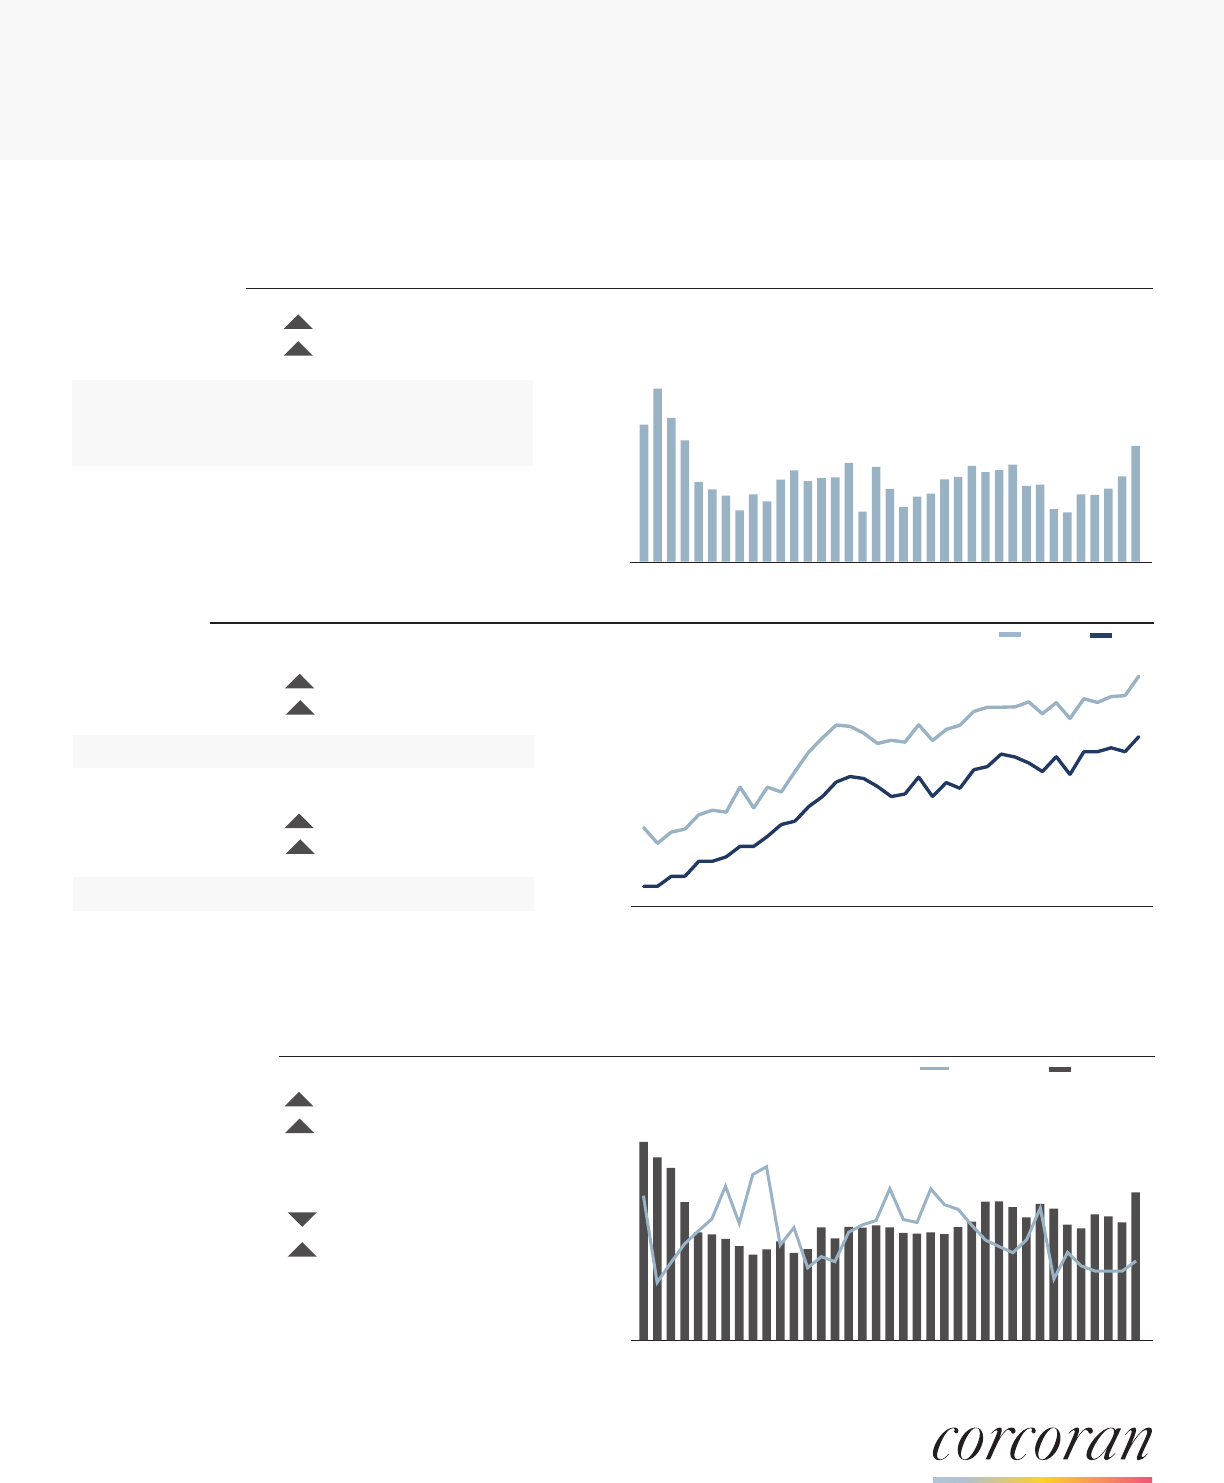
Despite median and average rents reaching new records, Brooklyn posted a strong May, expanding 21% annually, surpassing leasing activity from the previous
two years. Active listings were up 25% annually and compared with April. Four neighborhoods achieved new records for average rent.
SIGNED LEASES
NUMBER OF LEASE SIGNED
3,000
2,500
2,000
1,500
1,000
500
0
Reported signed leases increased 21% year-over-year and by 36%
compared to April. Although a monthly May increase is typical due
to seasonality, the 36% gain exceeded the typical ve-year average
increase.
1,699
+21% VS. MAY 2023
+36% VS. APRIL 2024
Rent Rates
Average Listings
May 2023
May 2021
1,407
1,181
May marked the 32nd consecutive month of annual growth for
median and average rent. Average and median rent both reached
new record highs. Median rent reached above $4,000 for the rst
time.
May 2023
$3,769
Active listings declined month-over-month for the the fth time
in the past six months, which is a typical trend leading into the
summer leasing season. Days on market was 47% below last year’s
gure as newer to market units rented at a faster pace.
May 21
Jun 21
Jul 21
Aug 21
Sep 21
Oct 21
Nov 21
Dec 21
Jan 22
Feb 22
Mar 22
Apr 22
May 22
Jun 22
Jul 22
Aug 22
Sept 22
Oct 22
Nov 22
Dec 22
Jan 23
Feb 23
Mar 23
Apr 23
May 23
Jun 23
Jul 23
Aug 23
Sept 23
Oct 23
Nov 23
Dec 23
Jan 24
Feb 24
Mar 24
April 24
May 24
MONTHLY RENT
MEDIAN RENT
$4,600
$4,400
$4,200
$4,000
$3,800
$3,600
$3,400
$3,200
$3,000
$2,800
$2,600
$2,400
May 21
Jun 21
Jul 21
Aug 21
Sep 21
Oct 21
Nov 21
Dec 21
Jan 22
Feb 22
Mar 22
Apr 22
May 22
Jun 22
Jul 22
Aug 22
Sept 22
Oct 22
Nov 22
Dec 22
Jan 23
Feb 23
Mar 23
Apr 23
May 23
Jun 23
Jul 23
Aug 23
Sept 23
Oct 23
Nov 23
Dec 23
Jan 24
Feb 24
Mar 24
April 24
May 24
LISTED INVENTORY AND DAYS ON MARKET
AVERAGE RENT
6,000
5,000
4,000
3,000
2,000
1,000
0
May 21
Jun 21
Jul 21
Aug 21
Sep 21
Oct 21
Nov 21
Dec 21
Jan 22
Feb 22
Mar 22
Apr 22
May 22
Jun 22
Jul 22
Aug 22
Sept 22
Oct 22
Nov 22
Dec 22
Jan 23
Feb 23
Mar 23
Apr 23
May 23
Jun 23
Jul 23
Aug 23
Sept 23
Oct 23
Nov 23
Dec 23
Jan 24
Feb 24
Mar 24
April 24
May 24
The Corcoran Report
MAY 2024 | BROOKLYN | RENTAL MARKET
Average
Median
1
3,364
+25% VS. MAY 2023
+25% VS. APRIL 2024
Days on Market
47
-31% VS. MAY 2023
+15% VS. APRIL 2024
120
100
80
60
40
20
0
$4,099
+9% VS. MAY 2023
+4% VS. APRIL 2024
May 2023
$4,353
$4,706
+8% VS. MAY 2023
+4% VS. APRIL 2024
April 2024 Median Rent
May 2024 Average Rent
Listed Inventory
Days on Market
DAYS ON MARKET
May 2021 2,013

Figure reects leases reported signed within the report month reported by any agency in Brooklyn and may include furnished and/or short term rentals. Not all leases that are signed are publicly
reported. By bedroom stats exclude units larger than three bedrooms. Price gures based on last asking prices for leases reported signed but actual rents may be lower. Figure reects units actively
listed as of the last day of the report month. Days on market only reects units that were listed for more than one day prior to being marked as leased. All material herein is intended for information
purposes only and has been compiled from sources deemed reliable. Though information is believed to be correct, it is presented subject to errors, omissions, changes or withdrawal without
notice. This is not intended to solicit property already listed. Equal Housing Opportunity. The Corcoran Group is a licensed real estate broker. Owned and operated by Anywhere Real Estate LLC.
Leases Signed by Bedroom
The Corcoran Report
MAY 2024 | BROOKLYN | RENTAL MARKET
Leasing activity increased annually for all unit types. Studios had the
largest increase, up 26% compared to last May. The near three-year
high leasing gure reects pressure on the studio market as one
bedroom rents continue to soar.
Average Rent by Bedroom
Average rent rose year-over-year across all bedroom types, with
three-bedroom units seeing the most signicant increase at 19%,
reachinganewrecordhigh.SincehittingitslowestpointinJanuary
2021, three-bedroom rents have increased by an impressive 81%.
AVERAGE RENT BY BEDROOM
AVERAGE RENT
$7,000
$6,500
$6,000
$5,500
$5,000
$4,500
$4,000
$3,500
$3,000
$2,500
$2,000
May 21
Jun 21
Jul 21
Aug 21
Sep 21
Oct 21
Nov 21
Dec 21
Jan 22
Feb 22
Mar 22
Apr 22
May 22
Jun 22
Jul 22
Aug 22
Sept 22
Oct 22
Nov 22
Dec 22
Jan 23
Feb 23
Mar 23
Apr 23
May 23
Jun 23
Jul 23
Aug 23
Sept 23
Oct 23
Nov 23
Dec 23
Jan 24
Feb 24
Mar 24
Apr 24
May 24
SIGNED LEASES BY BEDROOM TYPE
NUMBER OF LEASES SIGNED
1,000
900
800
700
600
500
400
300
200
100
0
May 21
Jun 21
Jul 21
Aug 21
Sep 21
Oct 21
Nov 21
Dec 21
Jan 22
Feb 22
Mar 22
Apr 22
May 22
Jun 22
Jul 22
Aug 22
Sept 22
Oct 22
Nov 22
Dec 22
Jan 23
Feb 23
Mar 23
Apr 23
May 23
Jun 23
Jul 23
Aug 23
Sept 23
Oct 23
Nov 23
Dec 23
Jan 24
Feb 24
Mar 24
Apr 24
May 24
Days on Market by Bedroom
Days on market decreased signicantly year-over-year, with all
unit types except studios experiencing double-digit declines.
High mortgage rates continue to push would-be-buyers into
the rental market,impacting the days on market gure for three
bedrooms in particular.
DAYS ON MARKET BY BEDROOM
AVERAGE DAYS ON MARKET
120
100
80
60
40
20
0
2
Studios
One Bedrooms
Two Bedrooms
Three Bedrooms
234
664
552
196
v26%
19%
v25%
7%
YoY
YoY
YoY
YoY
One BedroomsStudios
Two Bedrooms
Three Bedrooms
Studios
One Bedrooms
Two Bedrooms
Three Bedrooms
$3,312
$3,934
$5,085
$6,827
6%
10%
8%
19%
YoY
YoY
YoY
YoY
Studios
One Bedrooms
Two Bedrooms
Three Bedrooms
44
44
50
50
-4%
-35%
-23%
-48%
YoY
YoY
YoY
YoY
May 2023 Apr 2024 May 2024
One BedroomsStudios
Two Bedrooms
Three Bedrooms
One BedroomsStudios
Two Bedrooms
Three Bedrooms
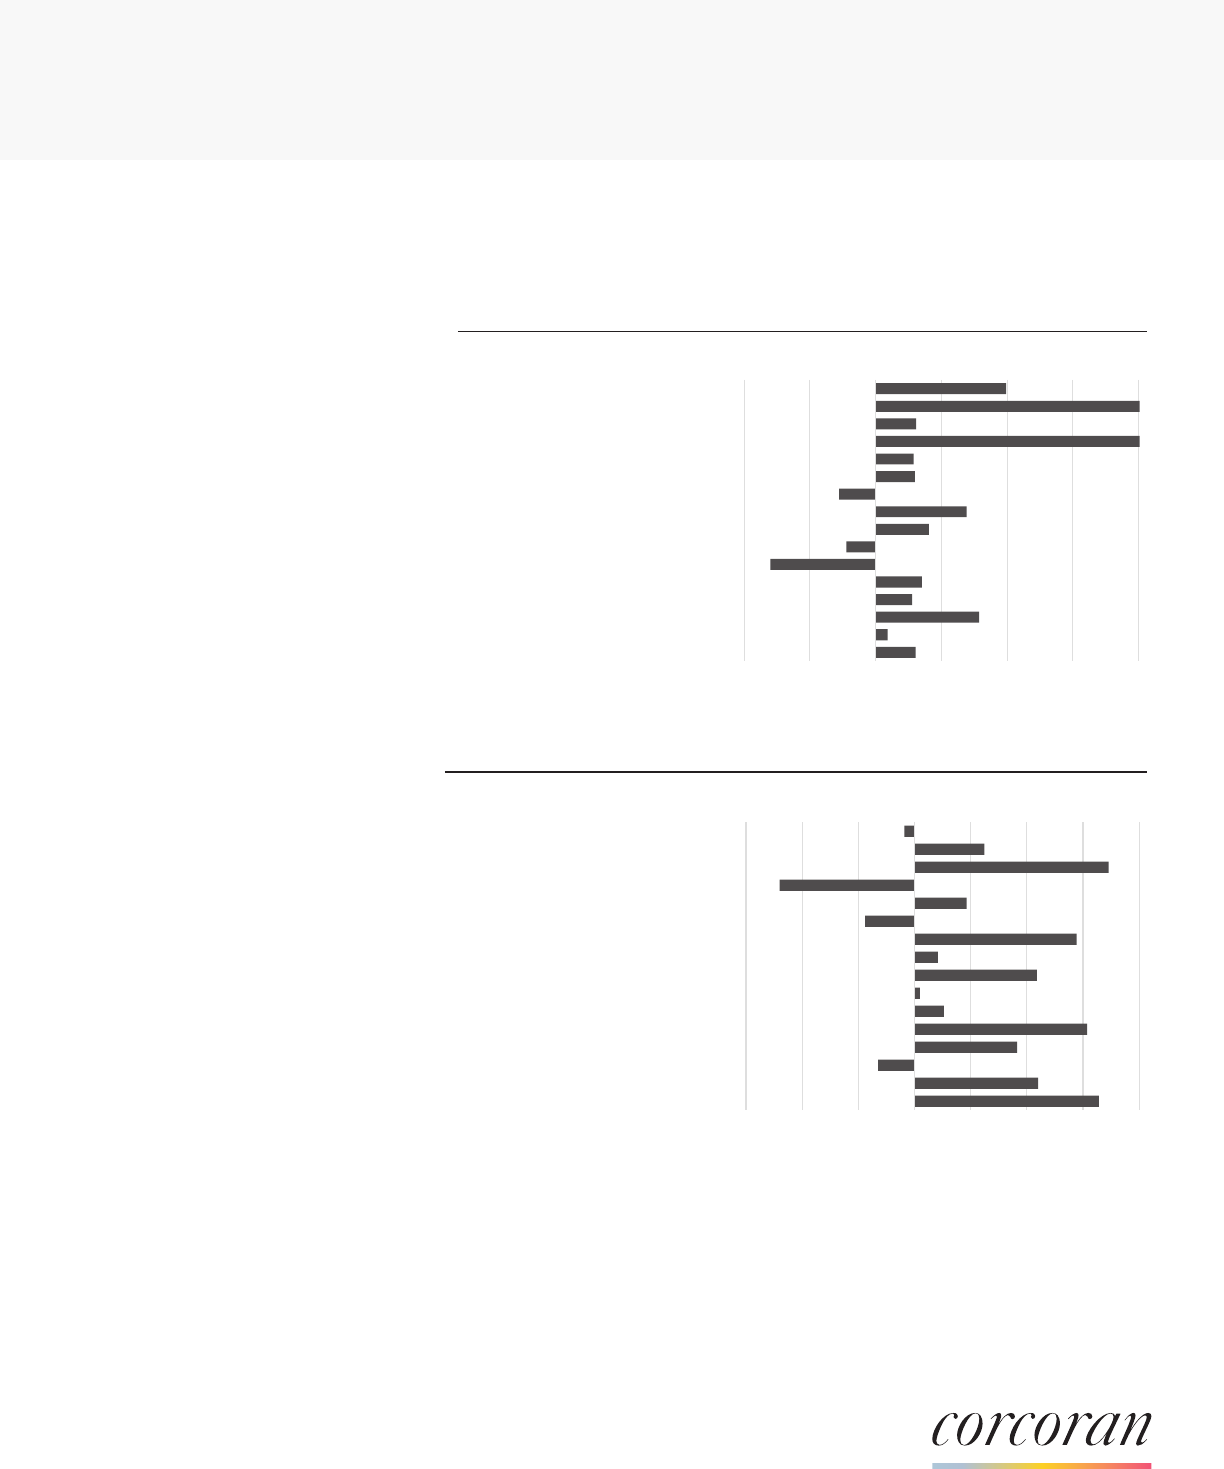
Figure reects leases reported signed within the report month reported by any agency in Brooklyn and may include furnished and/or short term rentals. Not all leases that are signed are publicly
reported. By bedroom stats exclude units larger than three bedrooms. Price gures based on last asking prices for leases reported signed but actual rents may be lower. Figure reects units actively
listed as of the last day of the report month. Days on market only reects units that were listed for more than one day prior to being marked as leased. All material herein is intended for information
purposes only and has been compiled from sources deemed reliable. Though information is believed to be correct, it is presented subject to errors, omissions, changes or withdrawal without
notice. This is not intended to solicit property already listed. Equal Housing Opportunity. The Corcoran Group is a licensed real estate broker. Owned and operated by Anywhere Real Estate LLC.
The Corcoran Report
MAY 2024 | BROOKLYN | RENTAL MARKET
May 2024: Leasing activity increased in all but two of sixteen Brooklyn neighborhoods. DUMBO nearly quadrupled its annual leasing activity, up
286% with strong activity at Magnolia DUMBO. South Williamsburg had the most signicant increase in rent, expanding 17%. Four neighborhoods,
south and east of Prospect Park established new records for average rent during this period.
Leases Signed by Neighborhood
May 2024 May 2023 YoY
Greenpoint
95 68
40%
North Williamsburg
236 113
109%
South Williamsburg
73 65
12%
DUMBO
54 14
286%
Brooklyn Heights
58 52
12%
Boerum Hill / Cobble Hill
66 59
12%
Carroll Gardens / Gowanus / Red Hook
72 81
-11%
Downtown Brooklyn
203 159
28%
Park Slope
136 117
16%
Fort Greene / Clinton Hill
123 135
-9%
Prospect Heights
53 78
-32%
Crown Heights / Prospect-Lefferts
89 78
14%
Bedford-Stuyvesant
140 126
11%
East Williamsburg/Bushwick
96 73
32%
Prospect Park South
85 82
4%
South Brooklyn
120 107
12%
ANNUAL CHANGE IN LEASES SIGNED
Greenpoint
North Williamsburg
South Williamsburg
DUMBO
Brooklyn Heights
Brm Hl / Cbl Hl
Crl Grds / Gwns / Rd Hk
Downtown Brooklyn
Park Slope
Fort Gr. / Clinton Hill
Prospect Heights
Crwn Hts / PLG
Bedford-Stuyvesant
East Williamsburg/Bushwick
Prospect Park South
South Brooklyn
3
Average Rent by Neighborhood
May 2024 May2023 YoY
Greenpoint
$4,820 $4,864
-1%
North Williamsburg
$5,320 $5,008
6%
South Williamsburg
$5,294 $4,513
17%
DUMBO
$6,774 $7,699
-12%
Brooklyn Heights
$7,111 $6,796
5%
Boerum Hill / Cobble Hill
$5,159 $5,396
-4%
Carroll Gardens / Gowanus / Red Hook
$5,231 $4,571
14%
Downtown Brooklyn
$4,880 $4,781
2%
Park Slope
$5,057 $4,560
11%
Fort Greene / Clinton Hill
$4,410 $4,389
0%
Prospect Heights
$4,603 $4,485
3%
Crown Heights / Prospect-Lefferts
$4,104 $3,557
15%
Bedford-Stuyvesant
$3,828 $3,507
9%
East Williamsburg/Bushwick
$3,548 $3,667
-3%
Prospect Park South
$3,601 $3,244
11%
South Brooklyn
$3,224 $2,769
16%
Greenpoint
North Williamsburg
South Williamsburg
DUMBO
Brooklyn Heights
Brm Hl / Cbl Hl
Crl Grds / Gwns / Rd Hk
Downtown Brooklyn
Park Slope
Fort Gr. / Clinton Hill
Prospect Heights
Crwn Hts / PLG
Bedford-Stuyvesant
East Williamsburg/Bushwick
Prospect Park South
South Brooklyn
0%
Prospect Park South includes Windsor Terrace, Greenwood Heights, Prospect Park South, Kensington and Flatbush. South Brooklyn includes neighborhoods south of Foster
Avenue, west of McDonald Avenue south of Greenwood Cemetery, east of Utica Avenue south of Fulton Street, and east of East New York Avenue south of Clarkson Avenue.
40%
ANNUAL CHANGE IN AVERAGE RENT
80%-40% -20%
*New Record
10%
0% 20% 60%
*
-15%
-10%
-5% 5%
15% 20%
*
*
*
